Modeling data with three (or more) levels
Part 2
Mar 27, 2024
Announcements
Quiz 04 - due March 28 at noon
Covers readings and lectures March 4 - 20
Longitudinal modeling, Chapter 9 of BMLR
Project 02
- Presentations April 3 during lecture
- Written report + GitHub repo due April 4 at 11:59pm
Final project - Round 1 submission (optional) due April 25
Topics
Write form of model for models with more than two levels
Interpret fixed and random effects at each level
See how three-level models are used in data analysis example
Data: Housing prices in Southampton
The data includes the price and characteristics for 918 houses sold between 1986 and 1991 in Southampton, England. The data were originally collected from a local real estate agency and were analyzed in Jones (1991). The primary variables of interest are
- price: Sales price in thousands of £
- Age: Age of the house
- Bedrooms: Number of bedrooms
- House Type: (semi-detached, detached, bungalow, terrace, flat)
- Central heating: Whether house has central heating (0: yes, 1: no)
- Garage: Number of garages (none, single, double)
- Districts: one of 34 districts
- Half-years: Half-year periods beginning the second half of 1986
Data structure
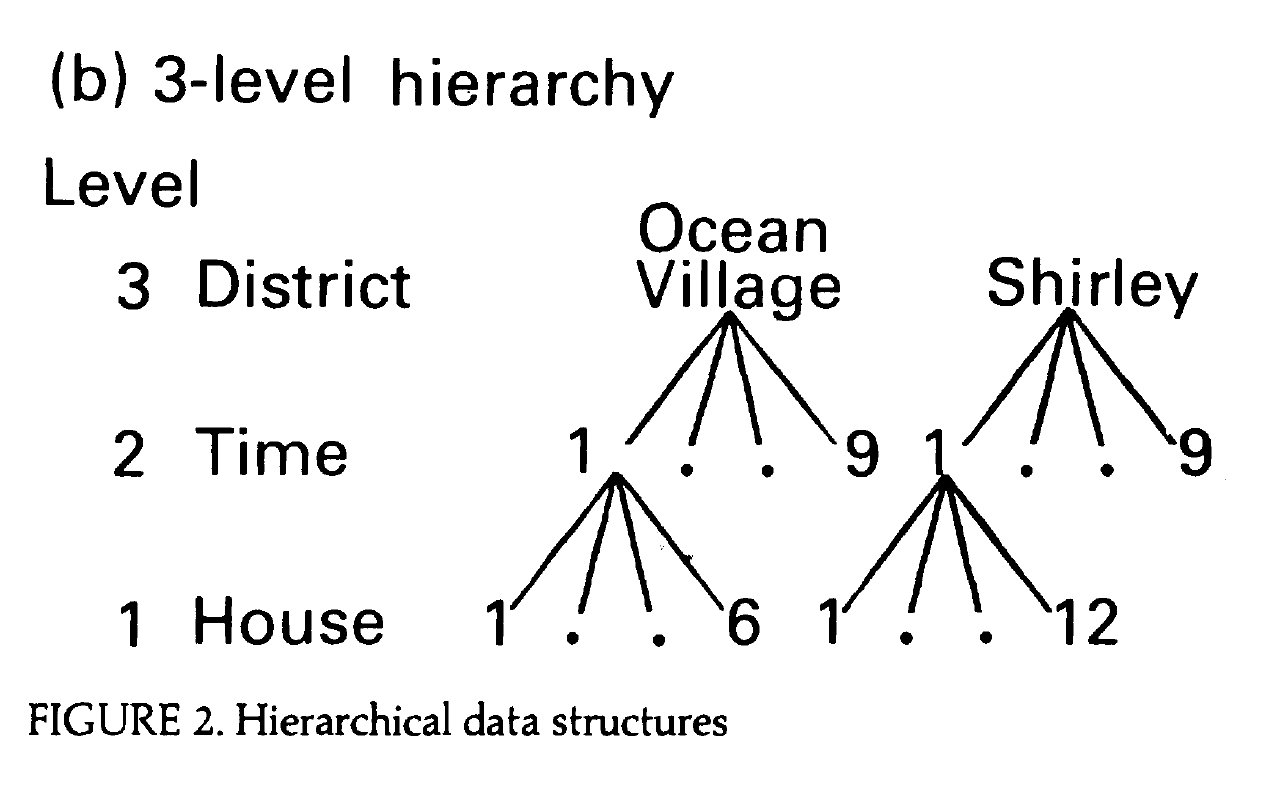
Portions of Figure 2b from Jones (1991)
Note
You can access the paper on Canvas.The paper uses different symbols to represent parameters than what is in the textbook. The slides will follow the textbook.
Unconditional means model
\[ \begin{aligned} &Y_{ijk} = \alpha_0 + \tilde{u}_i + u_{ij} + \epsilon_{ijk} \\[5pt] &\tilde{u}_i \sim N(0, \sigma^2_{\tilde{u}}) \hspace{8mm} u_{ij} \sim N(0, \sigma^2_{u}) \hspace{8mm} \epsilon_{ijk} \sim N(0, \sigma^2) \end{aligned} \]
Level One (house within time)
\(Y_{ijk} = a_{ij} + \epsilon_{ijk}, \hspace{10mm} \epsilon_{ijk} \sim N(0, \sigma^2)\)
Level Two (time within district)
\(a_{ij} = a_i + u_{ij}, \hspace{10mm} u_{ij} \sim N(0, \sigma^2_u)\)
Level Three (district)
\(a_{i} = \alpha_0 + \tilde{u}_{i}, \hspace{10mm} \tilde{u}_{i} \sim N(0, \sigma^2_{\tilde{u}})\)
Model A
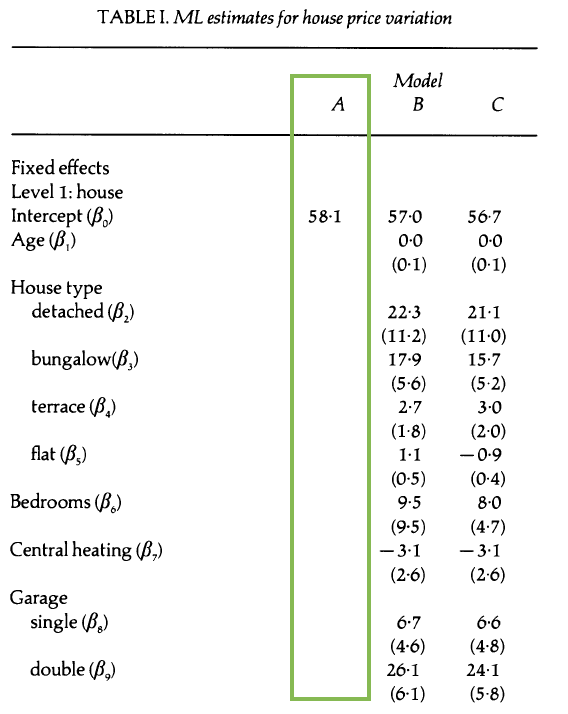
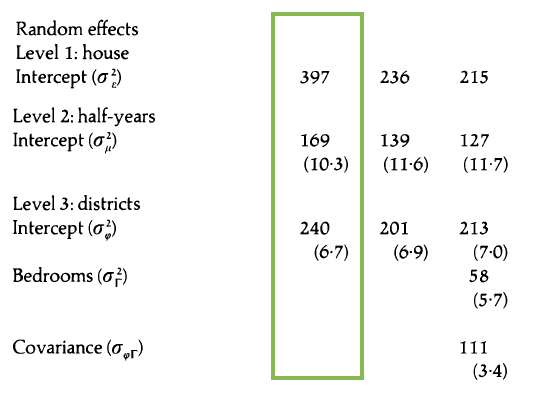
Interpret \(\hat{\beta}_0\) (this is \(\alpha_0\) in our model notation)
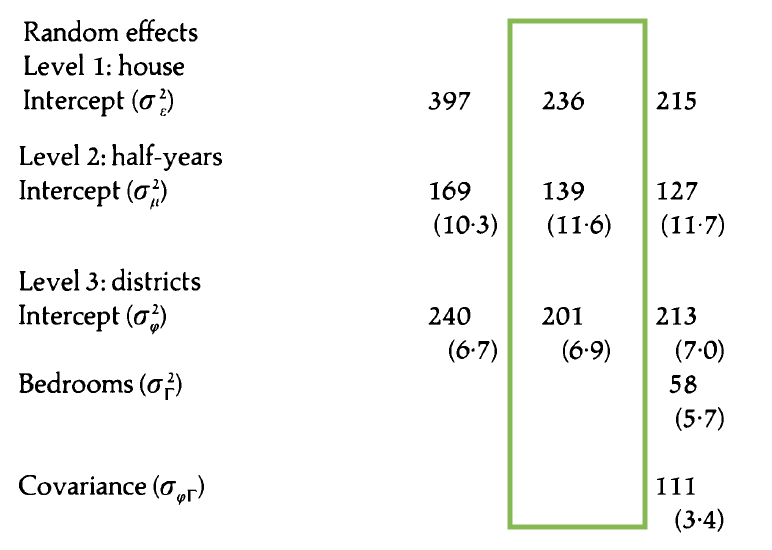
Model A: Random effects

- About 29.8% of the variability in price is explained by differences between districts.
- About 21% of the variability in price is explained by differences between time periods within the same district.
- About 49.2% of the variability in price is explained by differences between houses in the same district sold in the same time period.
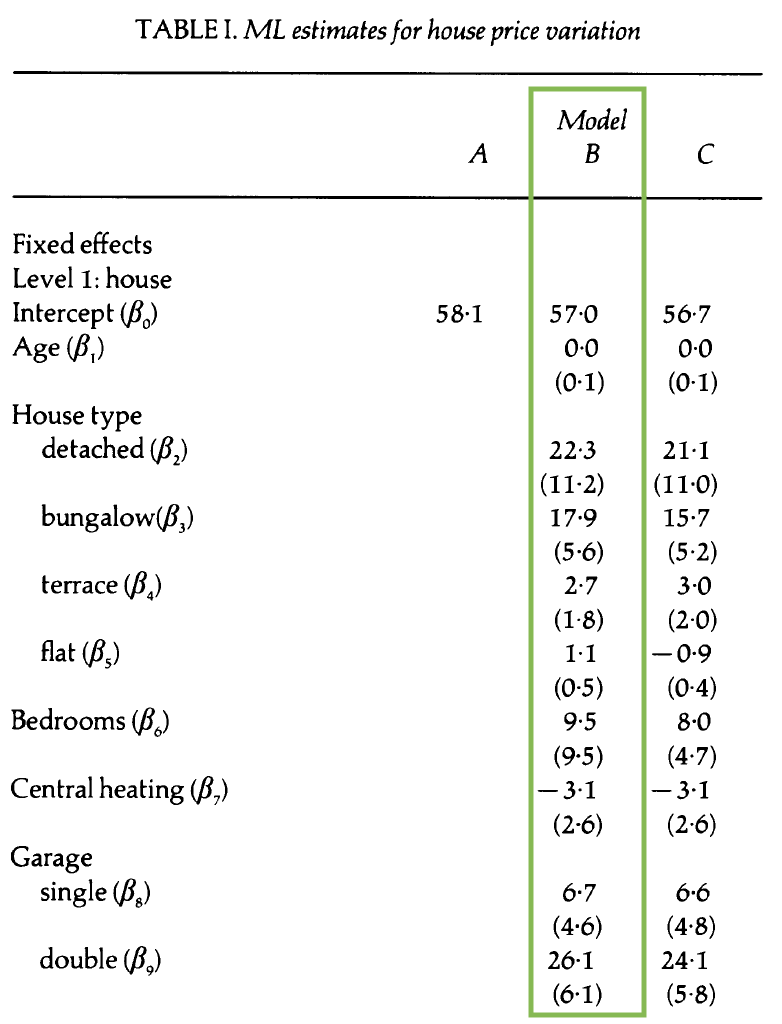
Model B: Covariates + random intercepts
Model B: Composite model
\[ \begin{aligned} Y_{ijk} &= \alpha_0 + \beta_1~age_{ijk} + \beta_2~detached_{ijk} + \beta_3 ~ bungalow_{ijk} \\ &+ \beta_4 ~ terrace_{ijk} + \beta_5~flat_{ijk} + \beta_6~bedrooms_{ijk} +\beta_7~heating_{ijk}\\ & + \beta_8~single_{ijk} + \beta_9 ~ double_{ijk} + [\tilde{u}_i + u_{ij} + \epsilon_{ijk}]\\[8pt] &\tilde{u}_i \sim N(0, \sigma^2_{\tilde{u}}) \hspace{8mm} u_{ij} \sim N(0, \sigma^2_{u}) \hspace{8mm} \epsilon_{ijk} \sim N(0, \sigma^2) \end{aligned} \]
Write the Level One, Level Two, Level Three models.
Model C: Additional random effect
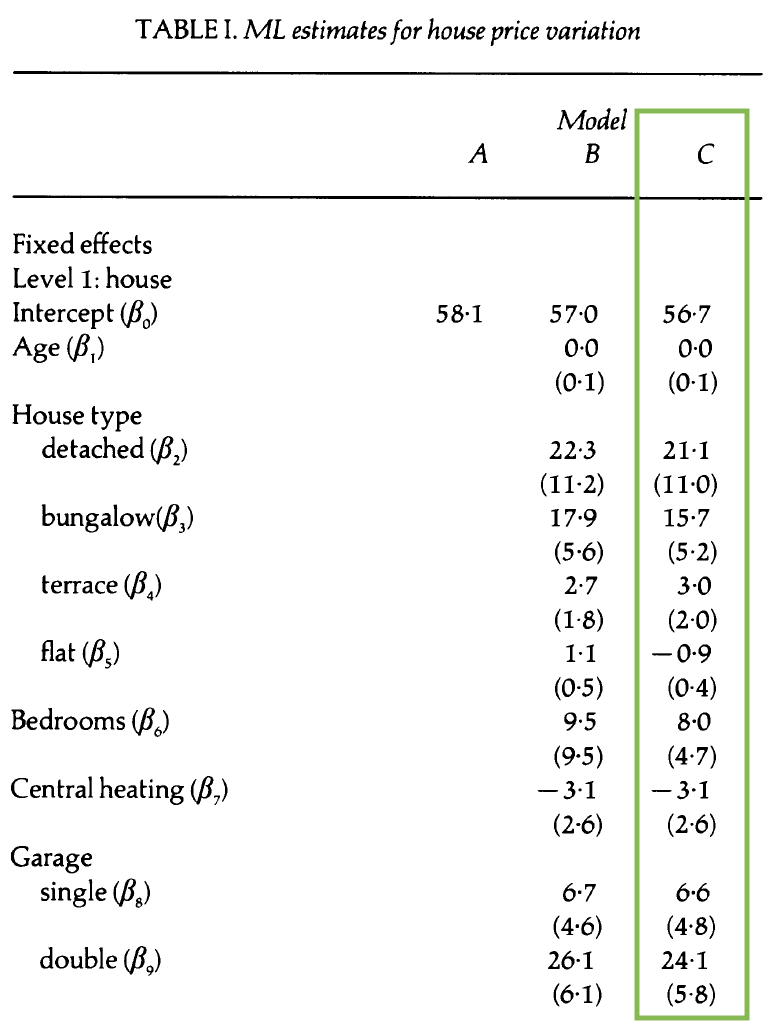
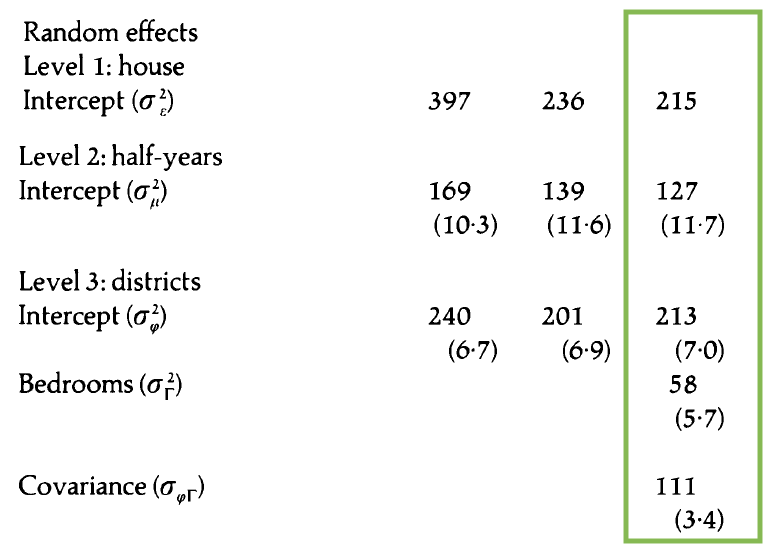
- How does this model differ from Model B?
- Write the composite model.
- Write the Level One, Level Two, and Level Three models.
Visualizing price by district over time

- What do you observe from the plot?
- What terms in the model can be understood from the plot?
- How might you use this type of plot to support decisions you make in the analysis?
Price by district and bedrooms

- What do you observe from the plot?
- What terms in the model can be understood from the plot?
- How might you use this type of plot to support decisions you make in the analysis?
How does our understanding of the effect of bedrooms differ in this model compared to Model B?
Covariance structure of observations
Questions we want to answer
Let’s consider the covariance structure between observations at different levels.
- What is the covariance structure of houses in the same district sold in different time periods? \((Y_{ij}, Y_{ij'})\)
- What is the covariance structure of houses in the same district sold in the same time period? \((Y_{ijk}, Y_{ijk'})\)
- How does this structure differ between Model B and Model C in Jones (1991)?
Calculating variance and covariance
Suppose \(Y_1 = a_1 X_1 + a_2 X_2 + a_3\) and \(Y_2 = b_1 X_1 + b_2 X_2 + b_3\) where \(X_1\) and \(X_2\) are random variables and \(a_i\) and \(b_i\) are constants for \(i = 1, 2, 3\), then we know from probability theory that: \[{\small\begin{aligned}Var(Y_1) & = a^{2}_{1} Var(X_1) + a^{2}_{2} Var(X_2) + 2 a_1 a_2 Cov(X_1,X_2) \\[10pt] Cov(Y_1,Y_2) & = a_1 b_1 Var(X_1) + a_2 b_2 Var(X_2) + (a_1 b_2 + a_2 b_1) Cov(X_1,X_2)\end{aligned}}\]
We will use these properties to define the covariance structure of the observations in the model.
Covariance structure under Model B
Let \(Y_{ijk}\) be the sales price for the house \(k\) in district \(i\) sold in time period \(j\), and \(x_1, \ldots, x_9\) be the house-level covariates. \[Y_{ijk} = \alpha_0 + \sum_{i = 1}^{9}\beta_ix_i + [\tilde{u}_i + u_{ij} + \epsilon_{ijk}]\] \[\tilde{u}_i \sim N(0, \sigma_{\tilde{u}}^2), \hspace{5mm} u_{ij} \sim N(0, \sigma^2_{u}), \hspace{5mm} \epsilon_{ijk} \sim N(0, \sigma^2)\]
Variance and covariance derivations
- Use Model B to write the derivation of \(Var(Y_{ijk})\), the variance of an individual observation.
- Use Model B to write the derivation of \(Cov(Y_{ijk}, Y_{ijk'})\), the covariance between houses sold in the same time period that are in the same district.
- Write \(Cov(\mathbf{Y}_{ij})\), covariance matrix for houses sold in the same time period in the same district
