Proportional odds + Probit regression

Prof. Maria Tackett

Feb 12, 2024

Announcements

  • Project 01

    • presentations in class Wed, Feb 14

    • write up due Thu, Feb 15 at 9pm

  • Quiz 02: Tue, Feb 20 - Thu, Feb 22

    • Covers readings & lectures: Jan 24 - Feb 12

    • Poisson regression, unifying framework for GLMs, logistic regression, proportional odds models, probit regression

Learning goals

  • Introduce proportional odds and probit regression models

  • Understand how these models are related to logistic regression models

  • Interpret coefficients in context of the data

  • See how these models are applied in research contexts

Notes based on Chapters 6 and 7 of McNulty (2021) unless stated otherwise.

Proportional odds models

Predicting ED wait and treatment times

Ataman and Sarıyer (2021) use ordinal logistic regression to predict patient wait and treatment times in an emergency department (ED). The goal is to identify relevant factors that can be used to inform recommendations for reducing wait and treatment times, thus improving the quality of care in the ED.

Data: Daily records for ED arrivals in August 2018 at a public hospital in Izmir, Turkey.

Click here to access the article on Canvas.

Predicting ED wait and treatment times

Response variables:

  • Wait time:

    • Patients who wait less than 10 minutes
    • Patients whose waiting time is in the range of 10 - 60 minutes
    • Patients who wait more than 60 minutes
  • Treatment time:

    • Patients who are treated for up to 10 minutes

    • Patients whose treatment time is in the range of 10 - 120 minutes

    • Patients who are treated for longer than 120 minutes

Predicting ED wait and treatment times

Predictor variables:

  • Gender:
    • Male
    • Female
  • Age:
    • 0 - 14
    • 15 - 64
    • 65 - 84
    • ≥ 85
  • Arrival mode:
    • Walk-in
    • Ambulance
  • Triage level:

    • Red (urgent)
    • Green (non-urgent)
  • ICD-10 diagnosis: Codes specifying patient’s diagnosis

Ordered vs. unordered variables

Categorical variables with 3+ levels

Unordered (Nominal)

  • Voting choice in election with multiple candidates

  • Type of cell phone owned by adults in the U.S.

  • Favorite social media platform among undergraduate students

Ordered (Ordinal)

  • Wait and treatment times in the emergency department

  • Likert scale ratings on a survey

  • Employee job performance ratings

Proportional odds model

Let Y be an ordinal response variable that takes levels 1,2,…,J with associated probabilities p1,p2,…,pJ

The proportional odds model can be written as the following:

log⁡(P(Y≤1)P(Y>1))=β01−β1x1−⋯−βpxplog⁡(P(Y≤2)P(Y>2))=β02−β1x1−⋯−βpxp…log⁡(P(Y≤J−1)P(Y>J−1))=β0J−1−β1x1−⋯−βpxp

What does β01 mean? What does β1 mean?

Proportional odds model

Let’s consider one portion of the model:

log⁡(P(Y≤k)P(Y>k))=β0k−β1x1−⋯−βpxp

  • The response variable is logit(Y≤k), the log-odds of observing an outcome less than or equal to category k.

  • βj>0 is associated with increased log-odds of being in a higher category of Y

    • eβj associated with an increased odds of being in a higher category of Y
  • Effect of one unit increase in xj the same regardless of which category of Y

Effect of arrival mode on waiting time

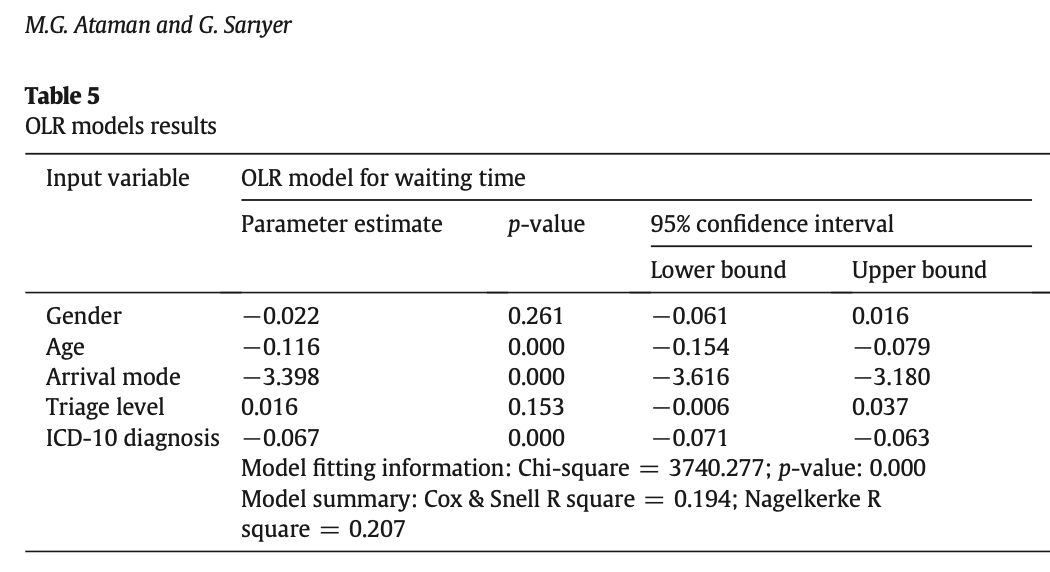
Waiting time model output from Ataman and Sarıyer (2021)

The variable arrival mode has two possible values: ambulance and walk-in. Describe the effect of arrival mode on waiting time. Note: The baseline category is walk-in.

Effect of triage level

Consider the full output with the ordinal logistic models for wait and treatment times.

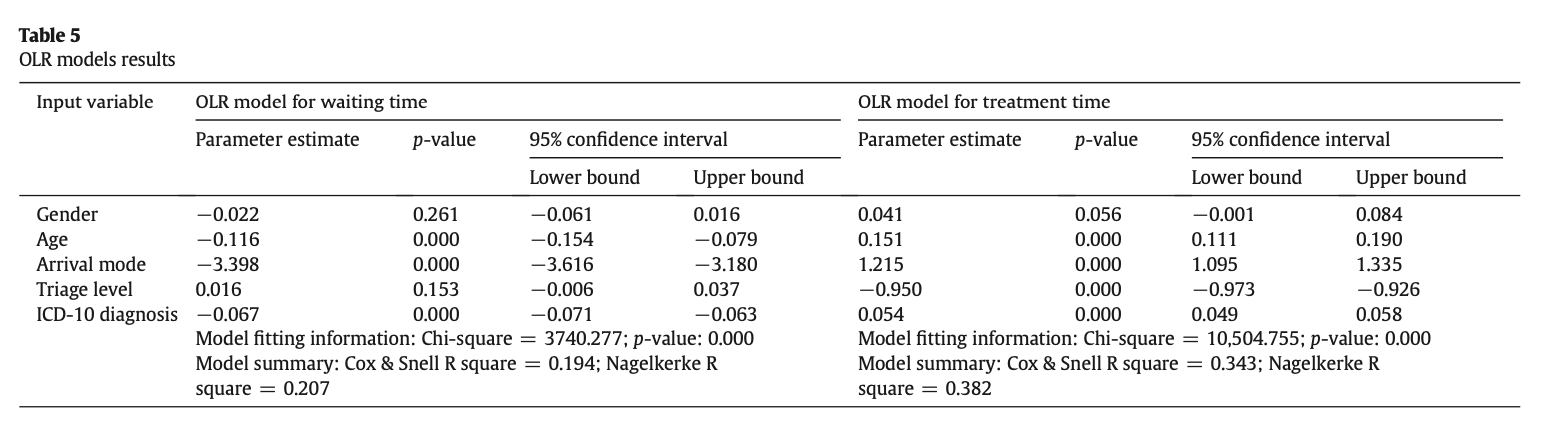
Waiting and treatment time model output from Ataman and Sarıyer (2021).

Use the results from both models to describe the effect of triage level on waiting and treatment times. Note: The baseline category is green.

02:00

Fitting proportional odds models in R

Fit proportional odds models using the polr function in the MASS package:

proportional_model <- polr(Y ~ x1 + x2 + x3, data = my_data)

Multinomial logistic model

Suppose the outcome variable Y is categorical and can take values 1,2,…,K such that

P(Y=1)=p1,…,P(Y=K)=pK and ∑k=1Kpk=1

Choose baseline category. Let’s choose Y=1 . Then

log⁡(P(Y=2)P(Y=1))=β02−β12x1−⋯−βp2xplog⁡(P(Y=3)P(Y=1))=β03−β13x1−⋯−βp3xp…log⁡(P(Y=K)P(Y=1))=β0K−β1Kx1−⋯−βpKxp

Multinomial logistic vs. proportional odds

How is the proportional odds model similar to the multinomial logistic model? How is it different? What is an advantage of each model? What is a disadvantage?

03:00

Probit regression

Impact of nature documentary on recycling

Ibanez and Roussel (2022) conducted an experiment to understand the impact of watching a nature documentary on pro-environmental behavior. The researchers randomly assigned the 113 participants to watch an video about architecture in NYC (control) or a video about Yellowstone National Park (treatment). As part of the experiment, participants were asked to dispose of their headphone coverings in a recycle bin available at the end of the experiment.

Click here to access the article on Canvas.

Impact of nature documentary on recycling

Response variable: Recycle headphone coverings vs. not

Predictor variables:

  • Age
  • Gender
  • Student
  • Made donation to environmental organization in previous part of experiment
  • Environmental beliefs measured by the new ecological paradigm scale (NEP)

Probit regression

Let Y be a binary response variable that takes values 0 or 1, and let p=P(Y=1|x1,…,xp)

probit(p)=Φ−1(p)=β0+β1x1+⋯+βpxp

where Φ−1 is the inverse normal distribution function.


The outcome is the z-score at which the cumulative probability is equal to p

  • e.g. probit(0.975)=Φ−1(0.975)=1.96

Interpretation

  • β^j is the estimated change in z-score for each unit increase in xj, holding all other factors constant.

  • This is a fairly clunky interpretation, so the (average) marginal effect of xj is often interpreted instead

  • The marginal effect of xj is essentially the change the probability from variable xj

Impact of nature documentary

Recycling model from Ibanez and Roussel (2022)

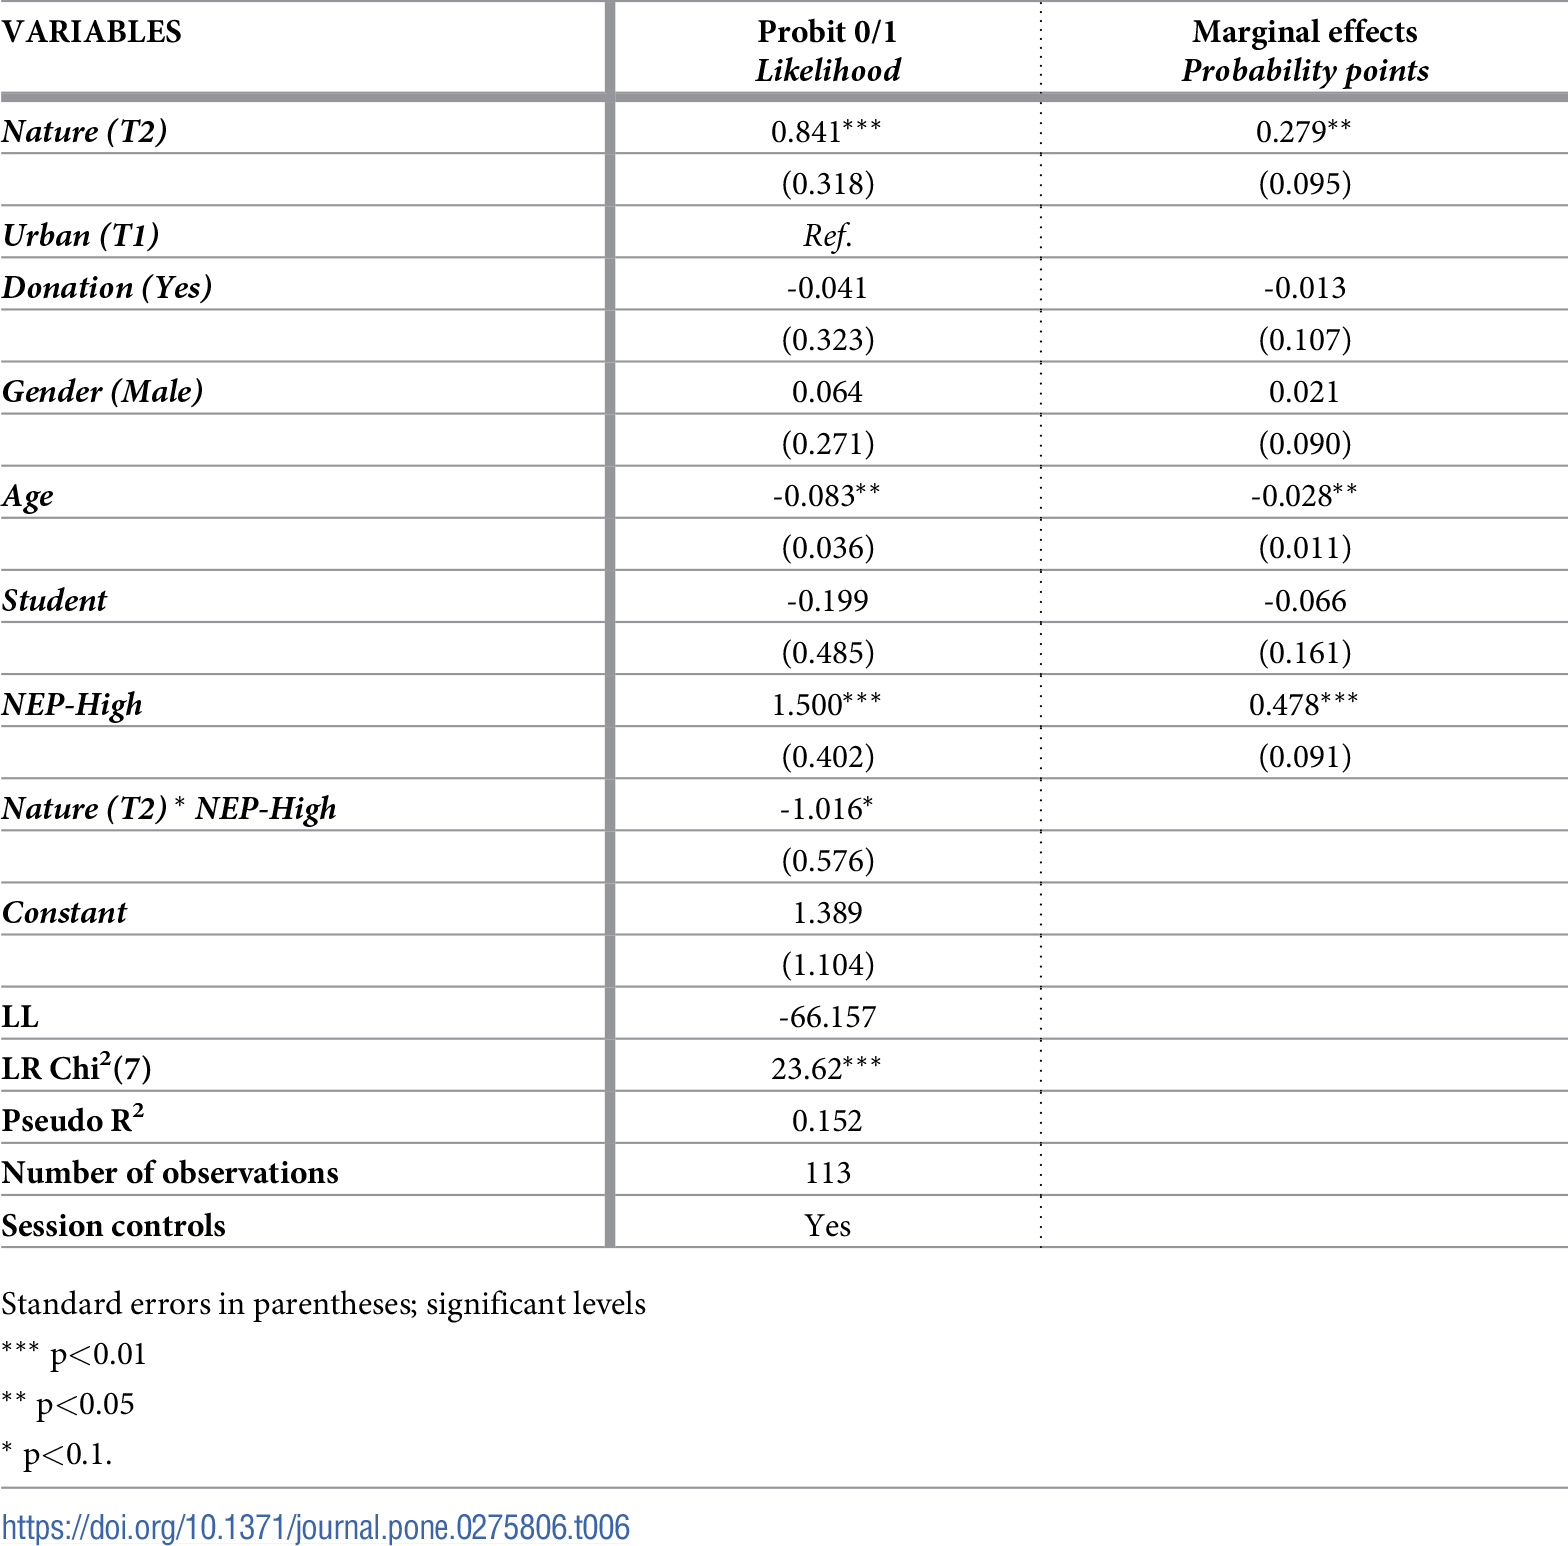
Interpret the effect of watching the nature documentary Nature (T2) on recycling. Assume NEP is low, NEP-High = 0.

Probit vs. logistic regression

Pros of probit regression:

  • Some statisticians like assuming the normal distribution over the logistic distribution.

  • Easier to work with in more advanced settings, such as multivariate and Bayesian modeling

Cons of probit regression:

  • Z-scores are not as straightforward to interpret as the outcomes of a logistic model.

  • We can’t use odds ratios to describe findings.

  • It’s more mathematically complicated than logistic regression.

  • It does not work well for response variable with 3+ categories

List adapted from Categorical Regression.

Fitting probit regression models in R

Fit probit regression models using the glm function with family = binomial(link = probit).


Calculate marginal effects using the margins function from the margins R package.

margins(my_model, variables = "my_variables")

Ideology vs. issue statements

Let’s look at the model using ideology and party ID to explain the number of issue statements by politicians. We will use probit regression for the “hurdle” part of the model - the likelihood a candidate comments on at least one issue (has_issue_stmt)

hurdle_probit <- glm(has_issue_stmt ~ ideology + democrat, 
             data = politics, 
             family = binomial(link = probit))

See Section 4.11.2 of Roback and Legler (2021) for more detail about the data.

Hurdle (using probit regression)

tidy(hurdle_probit) |>
  kable(digits = 3)
term estimate std.error statistic p.value
(Intercept) 1.272 0.117 10.829 0.000
ideology 0.262 0.089 2.926 0.003
democrat1 0.149 0.180 0.827 0.408
margins(hurdle_probit)
 ideology democrat1
  0.04071   0.02333

Interpret the effect of democrat on commenting on at least one issue.

Hurdle (using logistic regression)

hurdle_logistic <- glm(has_issue_stmt ~ ideology + democrat, 
             data = politics, 
             family = binomial)

tidy(hurdle_logistic) |>
  kable(digits = 3)
term estimate std.error statistic p.value
(Intercept) 2.127 0.225 9.465 0.000
ideology 0.575 0.167 3.446 0.001
democrat1 0.428 0.349 1.225 0.221

Probit vs. logistic models

Probit model

term estimate
(Intercept) 1.272
ideology 0.262
democrat1 0.149

Logistic model

term estimate
(Intercept) 2.127
ideology 0.575
democrat1 0.428


Suppose there is democratic representative with ideology score -2.5. Based on the probit model, what is the probability they will comment on at least one issue? What is the probability based on the logistic model?

03:00

Wrap up GLM for independent observations

Wrap up

  • Covered fitting, interpreting, and drawing conclusions from GLMs

    • Looked at Poisson, Negative Binomial, and Logistic, Proportional odds, and Probit models in detail
  • Used Pearson and deviance residuals to assess model fit and determine if new variables should be added to the model

  • Addressed issues of overdispersion and zero-inflation

  • Used the properties of the one-parameter exponential family to identify the best link function for any GLM

Everything we’ve done thus far as been under the assumption that the observations are independent. Looking ahead we will consider models for data with dependent (correlated) observations.

References

Ataman, Mustafa Gökalp, and Görkem Sarıyer. 2021. “Predicting Waiting and Treatment Times in Emergency Departments Using Ordinal Logistic Regression Models.” The American Journal of Emergency Medicine 46: 45–50.
Ibanez, Lisette, and Sébastien Roussel. 2022. “The Impact of Nature Video Exposure on Pro-Environmental Behavior: An Experimental Investigation.” Plos One 17 (11): e0275806.
McNulty, Keith. 2021. Handbook of Regression Modeling in People Analytics: With Examples in r and Python. CRC Press.
Roback, Paul, and Julie Legler. 2021. Beyond multiple linear regression: applied generalized linear models and multilevel models in R. CRC Press.

🔗 STA 310 - Spring 2024

1 / 30
Proportional odds + Probit regression Prof. Maria Tackett Feb 12, 2024

  1. Slides

  2. Tools

  3. Close
  • Proportional odds + Probit regression
  • Announcements
  • Learning goals
  • Proportional odds models
  • Predicting ED wait and treatment times
  • Predicting ED wait and treatment times
  • Predicting ED wait and treatment times
  • Ordered vs. unordered variables
  • Proportional odds model
  • Proportional odds model
  • Effect of arrival mode on waiting time
  • Effect of triage level
  • Fitting proportional odds models in R
  • Multinomial logistic model
  • Multinomial logistic vs. proportional odds
  • Probit regression
  • Impact of nature documentary on recycling
  • Impact of nature documentary on recycling
  • Probit regression
  • Interpretation
  • Impact of nature documentary
  • Probit vs. logistic regression
  • Fitting probit regression models in R
  • Ideology vs. issue statements
  • Hurdle (using probit regression)
  • Hurdle (using logistic regression)
  • Probit vs. logistic models
  • Wrap up GLM for independent observations
  • Wrap up
  • References
  • f Fullscreen
  • s Speaker View
  • o Slide Overview
  • e PDF Export Mode
  • b Toggle Chalkboard
  • c Toggle Notes Canvas
  • d Download Drawings
  • ? Keyboard Help